


What Is a Good ROAS for E-commerce? (How to Calculate and Benchmark It)

Author
TWOads Agency 4 min read
  21 July, 2026
Quick answer
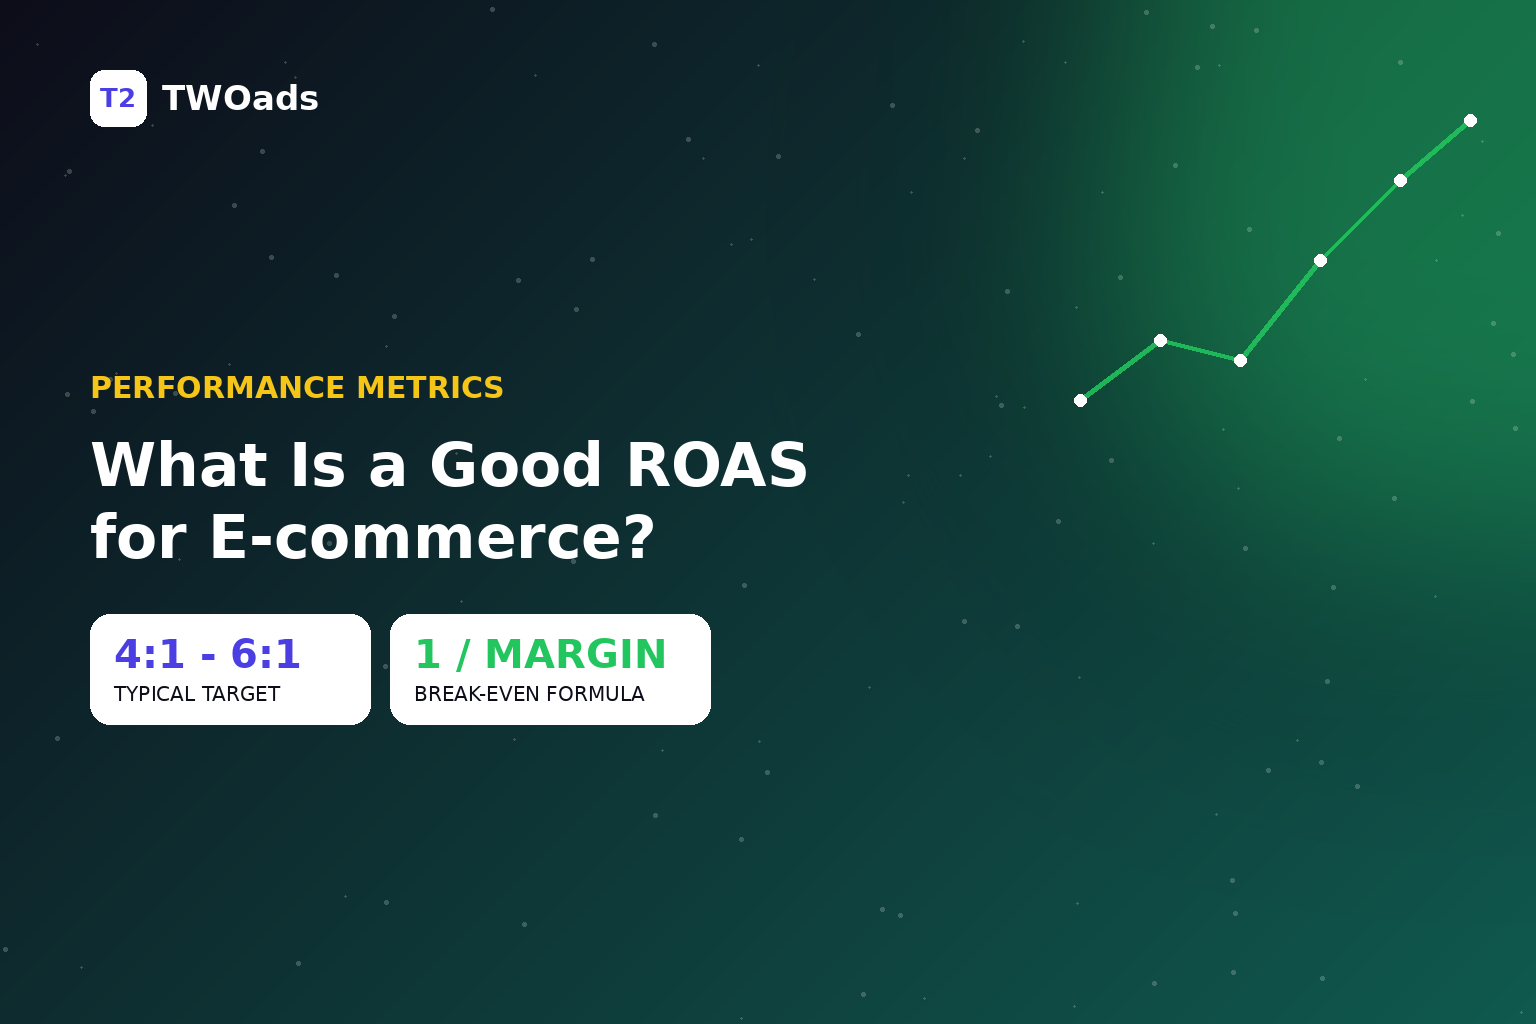
A “good” ROAS (Return on Ad Spend) for e-commerce typically falls between 4:1 and 6:1 — meaning €4–€6 in revenue for every €1 spent on ads — but the actual number that makes your store profitable depends entirely on your profit margin, not on a universal benchmark. A store with a 60% margin can be profitable at a ROAS of 2:1. A store with a 15% margin might need a ROAS of 7:1 or higher to break even. There is no single “good” ROAS that applies to every business.
How is ROAS calculated?
ROAS = Revenue from ads ÷ Ad spend
Example: if you spent €1,000 on Google Ads and generated €4,000 in tracked revenue, your ROAS is 4,000 ÷ 1,000 = 4 (often written as 4:1 or 400%).
This is different from ROI (Return on Investment), which factors in your cost of goods, not just ad spend:
ROI = (Revenue − Total Costs) ÷ Total Costs
ROAS tells you how efficiently your ad spend converts to revenue. ROI tells you whether the campaign is actually profitable after accounting for what the product cost you to make or buy. A store can have a “good” ROAS on paper and still lose money if margins are thin enough — which is why ROAS should never be read in isolation.
What ROAS do you actually need to break even?
Your break-even ROAS is a function of your margin, not a fixed number:
Break-even ROAS = 1 ÷ Profit margin (as a decimal)
| Profit Margin | Break-Even ROAS |
|---|---|
| 15% | 6.67 |
| 25% | 4.00 |
| 40% | 2.50 |
| 60% | 1.67 |
A store with a 60% margin is already profitable at a ROAS of 1.67 — a number that would be a loss-making disaster for a store running on a 15% margin. This is the single most common mistake in ROAS benchmarking: comparing your account’s ROAS to a generic industry number instead of to your own break-even point.
Real ROAS transformations from Google Ads accounts
Rather than relying only on generic benchmarks, here’s what ROAS ranges have looked like in practice across different e-commerce niches after structural account optimization (feed restructuring, CSS migration, and segmentation):
| Niche | ROAS Before | ROAS After |
|---|---|---|
| Garden / fertilizer products | 0.80 | 4.17 |
| IT&C (tech, components, gadgets) | 1.41 | 4.54 |
Read more: From Loss to Profit: Supplemental Feeds and CSS (ROAS 0.80 → 4.17)
Read more: IT&C Case Study: How We Tripled Sales and Grew ROAS to 4.54 in 30 Days
Why does ROAS vary so much by niche?
- Margin structure — commoditized categories (electronics accessories) run thin margins and need higher ROAS to be viable; niche or private-label products with fatter margins can sustain lower ROAS profitably
- Average order value (AOV) — higher AOV spreads fixed costs (like a customer’s first-click acquisition cost) over more revenue per order
- Repeat purchase rate — a store with strong repeat buyers can accept a lower ROAS on new-customer acquisition because lifetime value, not the first order alone, is what pays it back
- Auction cost inflation — competitive niches see rising CPCs year over year, which mechanically pressures ROAS downward unless efficiency improves elsewhere
Three levers that move ROAS without touching your budget
- Feed optimization. Titles, attributes, and custom labels determine which searches your products match. Poorly structured feeds waste impressions on irrelevant queries and starve high-margin products of visibility.
- CSS routing. A ~20% CPC discount through a certified CSS partner directly improves ROAS, since the denominator of the ROAS formula (spend) drops while revenue holds steady.
- Budget segmentation by price tier. Splitting high-ticket and low-ticket products into separate campaigns with separate bidding strategies stops the algorithm from over-indexing on cheap, high-volume items at the expense of higher-margin ones.
Read more: What Is Google CSS and How Does It Lower Your CPC?
How to know if your ROAS is actually good
Ask these questions, in order:
- What’s my break-even ROAS, based on my actual margin? (Not an industry average — your number.)
- Is my current ROAS above or below that break-even point, and by how much?
- What’s my target ROAS after accounting for overhead, returns, and customer acquisition cost beyond the first order?
- Is my ROAS trending up or down over the last 3 months, independent of the absolute number?
A ROAS of 3 that’s climbing month over month, on a healthy margin, is a better signal than a ROAS of 6 that’s been slowly declining on a thin-margin account already near its break-even point.
Summary
There’s no universal “good” ROAS — there’s only a ROAS that’s good for your margin structure. Calculate your break-even point first, then use industry ranges (typically 4:1–6:1 for general e-commerce) only as a rough sanity check, not a target.
Want an honest read on where your account’s ROAS actually stands? Contact TWOads for a free Google Ads and Merchant Center audit.
Contact

Thank you for your message!
We're excited to help you. We will contact you as soon as possible!